Azure Local - Kubernetes - Part 8 - Fix: Foundry Local model stuck in Creating
- Intro
- Problem: Creating does not tell us what is blocked
- Troubleshoot: Follow ModelDeployment to StoreModel to Job to Pod
- Root cause: Cache memory is separate from inference memory
- Solution: Reduce cache memory and recreate the pending job
- Verify: Running is not the same as finished
- Final remark
Intro
This article is part of a series: Navigate to series page
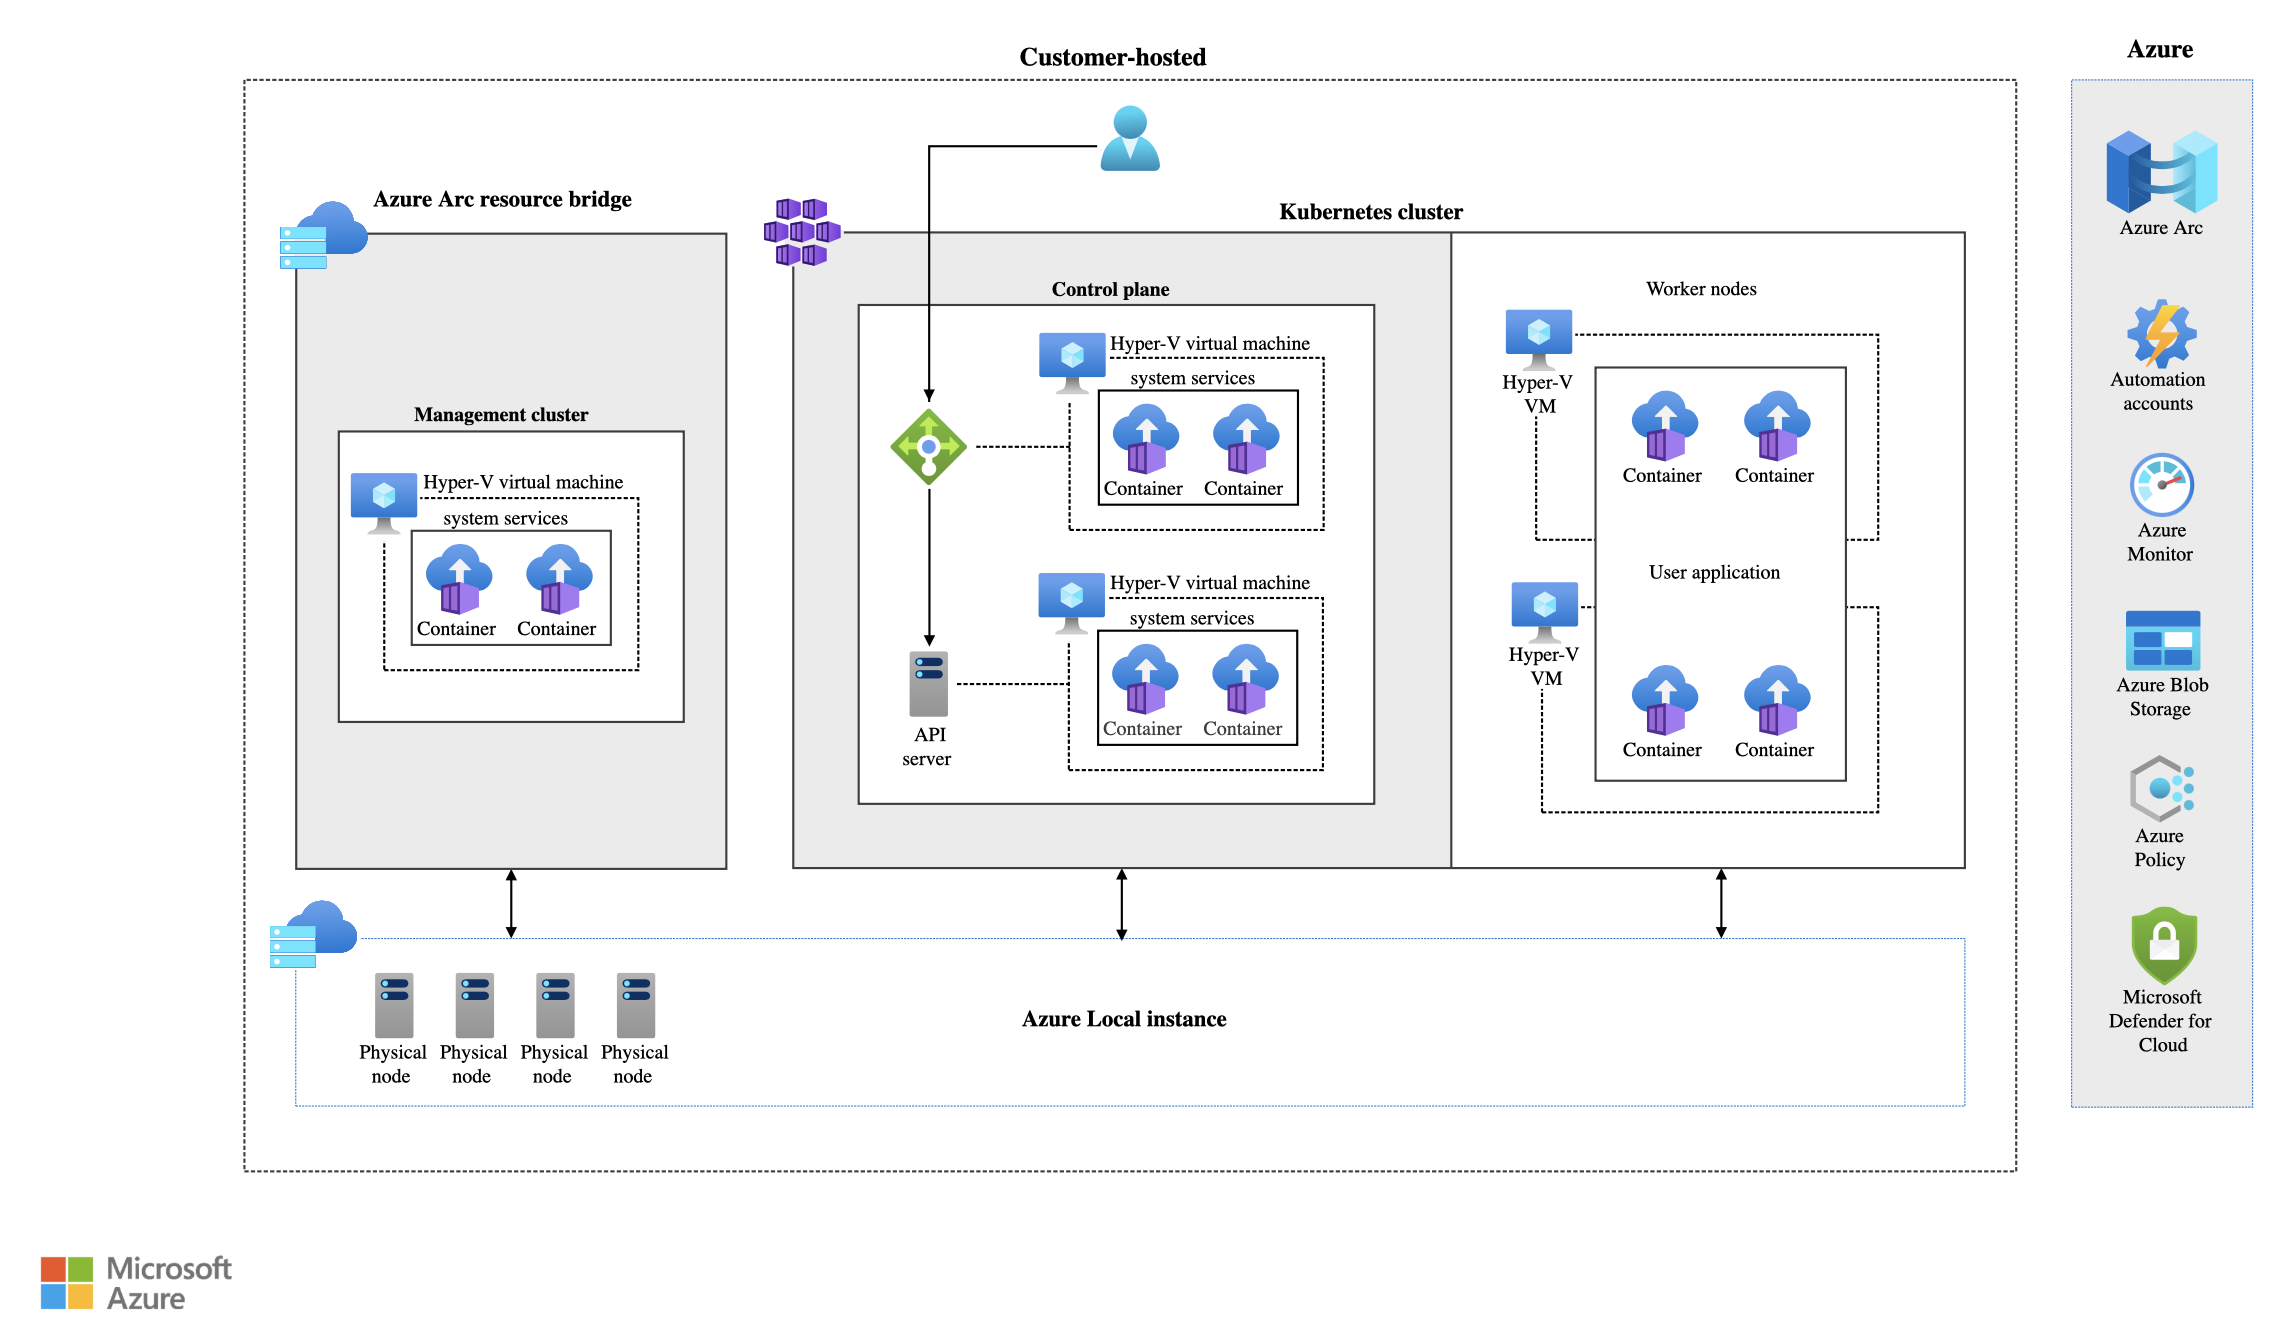
In Part 7, I deployed Foundry Local on Azure Local. During a deployment using version 1.260914.4, my small Qwen3 0.6B CPU model stayed in Creating for more than half an hour, with no inference replicas.
The issue was not the inference pod. The operator was waiting for a model-cache job that could not even start: its default memory request exceeded the allocatable memory on either worker node. Here is how I followed the dependency chain, reduced the cache-job memory, and got the model running.
Problem: Creating does not tell us what is blocked
I started with:
kubectl get modeldeployment qwen3-0-6b-generic-cpu -n foundry-local-operatorThe output stayed like this:
NAME                     WORKLOAD     COMPUTE   STATE      READY   REPLICAS   AGE
qwen3-0-6b-generic-cpu     generative   cpu       Creating   false   0          34m
Creating alone does not identify the cause. Before restarting anything, we need to find which dependency the operator is waiting for.
I use PowerShell throughout this guide, with Azure CLI, kubectl, and helm available on my workstation. See Part 2 for connecting to the cluster, including Entra-authenticated proxy mode. Keep the proxy window open while troubleshooting from another window.
Troubleshoot: Follow ModelDeployment to StoreModel to Job to Pod
1. Inspect the ModelDeployment
$ns = "foundry-local-operator"
$model = "qwen3-0-6b-generic-cpu"

kubectl config current-context
kubectl describe modeldeployment $model -n $ns
kubectl get events -n $ns --sort-by=.metadata.creationTimestamp |
  Select-Object -Last 50
My events repeatedly showed:
Resolved model: qwen3-0.6b-generic-cpu (catalog)
Waiting for StoreModel foundry-local-qwen3-0-6b-cpu-onnx-4 (phase=Storing)
The catalogue lookup succeeded. The blocker was the StoreModel, which tracks downloading and caching the model in the local OCI registry. The operator waits for that cache before creating the inference workload.
2. Inspect the StoreModel
Use the StoreModel name from your own events; it depends on the resolved model and version.
$storeModel = "foundry-local-qwen3-0-6b-cpu-onnx-4"

kubectl describe storemodel $storeModel -n $ns
In my case, the status contained:
Job Name:      cache-foundry-local-qwen3-0-6b-cpu-onnx-4
Phase:         Storing
Store Error:
An empty Store Error did not mean the cache was progressing. Likewise, the repeated successful check_storemodel_ttl messages were housekeeping checks, not download progress.
For the lifecycle details, see Model caching and StoreModel lifecycle.
3. Inspect the cache job and its pod
$jobName = "cache-foundry-local-qwen3-0-6b-cpu-onnx-4"

kubectl describe job $jobName -n $ns
kubectl get pods -n $ns -l "job-name=$jobName" -o wide
kubectl describe pods -n $ns -l "job-name=$jobName"
The cache pod was Pending, with no node or IP assigned. Its Events gave us the actual cause:
0/3 nodes are available: 1 node(s) had untolerated taint {node-role.kubernetes.io/control-plane: }, 2 Insufficient memory.For other deployments, the same commands may reveal a different issue:
| Finding | What I would inspect next |
|---|---|
Pending with FailedScheduling | CPU/memory requests, taints, node selectors, or volumes |
ContainerCreating or stuck initializing | Image pulls, certificate/configuration mounts, and init-container states |
ImagePullBackOff | Image reference, registry access, credentials, and networking |
| Failed or restarting container | Termination reason, OOMKilled, and previous container logs |
| Running cache pod | Download logs and file growth |
Completed job but StoreModel still Storing | Operator logs and status reconciliation |
There is no point checking download logs for an unscheduled pod: its cache container has not started.
Root cause: Cache memory is separate from inference memory
My model manifest requested only 2Gi for inference, but the cache job had different defaults:
Requests:
  cpu:     1
  memory:  16Gi
Limits:
  cpu:     2
  memory:  32Gi
I checked the worker nodes:
kubectl describe nodesThe relevant values were:
| Worker | Allocatable memory | Existing memory requests | Remaining request capacity |
|---|---|---|---|
moc-lhwo19q0ml5 | 12.93 GiB | 5.43 GiB | 7.50 GiB |
moc-lj80uzndhfm | 12.93 GiB | 4.24 GiB | 8.69 GiB |
Neither worker could fit a 16Gi request, even if all other workloads were removed. The cache pod also had sidecars with their own requests.
Scheduling uses resource requests, not current RAM usage or the container’s memory limit. A node reporting MemoryPressure: False can still lack enough unallocated request capacity.
HINT
Adding more workers of the same size would not fix this particular problem. One pod must fit on one eligible node. Increasing worker memory is an alternative to reducing the cache request; removing the control-plane taint is not the solution I recommend.
Solution: Reduce cache memory and recreate the pending job
1. Update the extension configuration
Microsoft documents storeModel.cacheJob.resources settings for constrained environments. For this small CPU model, I used a 2Gi request and 4Gi limit:
$subscriptionId = "<subscription-id>"
$resourceGroup = "<arc-cluster-resource-group>"
$clusterName = "<arc-cluster-name>"

az k8s-extension update `
  --subscription $subscriptionId `
  --resource-group $resourceGroup `
  --cluster-name $clusterName `
  --name "inference-operator" `
  --cluster-type connectedClusters `
  --configuration-settings `
    "storeModel.cacheJob.resources.requests.memory=2Gi" `
    "storeModel.cacheJob.resources.limits.memory=4Gi"
This changes cache-job configuration for the extension, not just this model. See the documented installation parameters.
HINT
These values worked for my Qwen3 0.6B CPU model. They are not validated sizing for larger models. A lower request helps scheduling, but a limit that is too low can cause
OOMKilledduring caching.
2. Confirm the settings reached the operator
helm get values inference-operator -n $ns -o json |
  ConvertFrom-Json |
  Select-Object -ExpandProperty storeModel |
  ConvertTo-Json -Depth 10

kubectl rollout status deployment/inference-operator -n $ns --timeout=120s
I confirmed the Helm values contained 2Gi and 4Gi, and the operator rollout completed.
However, this check still returned the old job resources:
kubectl get job $jobName -n $ns `
-o jsonpath="{.spec.template.spec.containers[?(@.name=='cache')].resources}"{"limits":{"cpu":"2","memory":"32Gi"},"requests":{"cpu":"1","memory":"16Gi"}}The extension update did not rewrite the existing Job’s pod template. Deleting only its pod would recreate another pod with the same old memory request.
3. Recreate only the unscheduled cache job
I used a one-time Kubernetes job recreation, preserving its StoreModel ownership and all other job settings. This is the workaround I used successfully, not a documented Foundry-specific retry command.
Only use this approach when the exact cache job is still pending and has never started. Do not use it for a running download, a completed cache, or a different failure without investigating first. The script below checks ownership and pod state, saves the original job and replacement manifest, and validates the replacement client-side before deletion.
The variables $ns, $jobName, and $storeModel must reference the resources identified above.
$job = kubectl get job $jobName -n $ns -o json | ConvertFrom-Json
if ($LASTEXITCODE -ne 0) { throw "Cannot read cache job." }

$store = kubectl get storemodel $storeModel -n $ns -o json | ConvertFrom-Json
if ($LASTEXITCODE -ne 0) { throw "Cannot read StoreModel." }
if ($store.status.phase -ne "Storing" -or $store.status.storeRef) {
  throw "StoreModel state changed. Stop and inspect."
}

$owner = @($job.metadata.ownerReferences | Where-Object {
  $_.kind -eq "StoreModel" -and
  $_.name -eq $storeModel -and
  $_.uid -eq $store.metadata.uid
})
if ($owner.Count -ne 1 -or $store.status.jobName -ne $jobName) {
  throw "Job does not match the expected StoreModel."
}
if ($job.status.succeeded -or $job.status.failed) {
  throw "Job has completed or failed attempts. Stop and inspect."
}

$pods = kubectl get pods -n $ns -l "job-name=$jobName" -o json |
  ConvertFrom-Json
if ($LASTEXITCODE -ne 0) { throw "Cannot read cache pods." }
if (@($pods.items).Count -ne 1) {
  throw "Expected one pending cache pod. Stop and inspect."
}
foreach ($pod in $pods.items) {
  if ($pod.status.phase -ne "Pending" -or $pod.spec.nodeName) {
    throw "Cache pod is no longer unscheduled. Stop and inspect."
  }
}

$cache = @($job.spec.template.spec.containers | Where-Object name -eq "cache")
if ($cache.Count -ne 1) { throw "Expected one cache container." }

$stamp = Get-Date -Format "yyyyMMdd-HHmmss"
$backupPath = Join-Path (Get-Location).Path "$jobName-$stamp-original.json"
$replacementPath = Join-Path (Get-Location).Path "$jobName-$stamp-replacement.json"
$job | ConvertTo-Json -Depth 100 |
  Set-Content $backupPath -Encoding utf8 -ErrorAction Stop

$cache[0].resources.requests.memory = "2Gi"
$cache[0].resources.limits.memory = "4Gi"

# Kubernetes must generate new controller identifiers for the replacement.
$job.spec.PSObject.Properties.Remove("selector")
$job.spec.PSObject.Properties.Remove("manualSelector")
foreach ($key in @(
  "controller-uid", "batch.kubernetes.io/controller-uid",
  "job-name", "batch.kubernetes.io/job-name"
)) {
  $job.spec.template.metadata.labels.PSObject.Properties.Remove($key)
}

$replacement = @{
  apiVersion = "batch/v1"
  kind = "Job"
  metadata = @{
    name = $jobName
    namespace = $ns
    labels = $job.metadata.labels
    ownerReferences = $job.metadata.ownerReferences
  }
  spec = $job.spec
}
$replacement | ConvertTo-Json -Depth 100 |
  Set-Content $replacementPath -Encoding utf8 -ErrorAction Stop

kubectl create --dry-run=client -f $replacementPath -o name
if ($LASTEXITCODE -ne 0) { throw "Replacement validation failed." }

kubectl delete job $jobName -n $ns --wait=true
if ($LASTEXITCODE -ne 0) { throw "Job deletion failed." }

kubectl create -f $replacementPath
if ($LASTEXITCODE -ne 0) {
  throw "Creation failed. Inspect the error; replacement saved at $replacementPath."
}
Run this during a controlled troubleshooting window and stop if the resource state changes. The client-side dry run does not prove that server admission will accept the replacement. If creation fails, inspect the error before retrying the saved replacement manifest.
This deletes only the named cache Job and its dependent pod. It does not delete the StoreModel, ModelDeployment, model-store registry, or its persistent volume. The original job had never scheduled, so there was no active download to interrupt.
Verify: Running is not the same as finished
After recreation, my cache pod scheduled onto a worker using the reduced resources:
kubectl get job $jobName -n $ns `
  -o jsonpath="{.spec.template.spec.containers[?(@.name=='cache')].resources}"
kubectl get pods -n $ns -l "job-name=$jobName" -o wide
kubectl logs "job/$jobName" -n $ns -c cache --tail=100 --follow
Here is the relevant container state from my running cache pod:
State:          Running
Ready:          True
Restart Count:  0
Limits:
  cpu:     2
  memory:  4Gi
Requests:
  cpu:     1
  memory:  2Gi
Press Ctrl+C to stop following logs without stopping the job.
My logs showed successful catalogue/download-URL resolution and then:
Downloading: v4/model.onnx (524,589,133 bytes)There were no new log entries for several minutes, but that did not mean the download had stopped. I inspected the actual download directory printed in the logs:
$pod = kubectl get pods -n $ns -l "job-name=$jobName" `
  -o jsonpath="{.items[0].metadata.name}"

# Replace this with the directory from your cache logs.
$downloadDirectory = "/tmp/model-cache-vfgbof_9/model"

kubectl exec $pod -n $ns -c cache -- du -sh $downloadDirectory
kubectl exec $pod -n $ns -c cache -- ls -lh "$downloadDirectory/v4/"
These diagnostics depend on the container having du and ls. In my case, model.onnx had reached about 180 MiB, with a recent modification time. Repeat the check after a minute: growing files indicate download progress. Unchanged sizes alone do not prove a stall, since downloaders can buffer data or use other temporary paths.
If the pod fails, use kubectl describe pods again to check termination reasons and events. For a restarted container, inspect previous logs with kubectl logs <pod-name> -n $ns -c cache --previous.
Finally, check the cache and deployment:
kubectl get storemodel $storeModel -n $ns
kubectl get modeldeployment $model -n $ns --watch
The expected cache phase is Available, followed by the operator creating the inference workload. My confirmed final deployment output was:
NAME                     WORKLOAD     COMPUTE   STATE     READY   REPLICAS   AGE
qwen3-0-6b-generic-cpu     generative   cpu       Running   true    1          95m
The 95-minute age includes the original scheduling wait and the later download/deployment time. It is not a model download benchmark. Completed cache jobs may also disappear automatically after their configured cleanup interval.
I confirmed deployment readiness in this environment. An inference request is a separate check; continue with the endpoint testing in Part 7.
Final remark
Final remark: Before changing the model manifest or reinstalling Foundry Local, follow the dependency chain: ModelDeployment -> StoreModel -> cache Job -> cache Pod.
In my case, a small model still triggered a cache job requesting more memory than any worker could provide. Reducing the extension’s cache settings and recreating the unscheduled job resolved that blocker. For future deployments, I will size caching separately from inference and configure the cache settings before creating models.
As always, match the fix to the evidence. These reduced values worked for this model and version, not every model. Keep the control plane protected, monitor cache memory usage, and distinguish an unscheduled pod from a slow but progressing download.
For additional failure paths, see Troubleshoot Foundry Local on Azure Local.
Have feedback on this post?
Send me a message and I'll get back to you.